Brief Introduction: For some reason the original post was deleted, so I went ahead and posted this again. Sorry about that.
These are my notes from Part 1 of the SANS webcast, “Intro to WinDbg,” hosted by Jonathan Reiter. Mr. Reiter is the author and instructor for SANS SEC 660 (GXPN) and SEC 670 (GRTP) , and he is also stationed at Fort Meade in the Maryland National Guard.
Getting Started: Launching and Configuration
This session was intended for complete beginners who have never used WinDbg before.
It began with a look at the WinDbg UI, which primarily consists of the Command Window, Disassembly Window, and Memory Window. Unlike WinDbg Classic, which allowed you to save and transport workspace layout files, the newer version requires you to set up the layout on each system individually.
There are several ways to start a debugging session:
- Launch Executable: This option is used to browse your filesystem and select an executable, dump file, or trace file.
- Launch Executable (advanced): This option provides more control, supporting time-travel debugging. It allows you to start the file with specific command-line arguments and choose its starting directory. When using this, the “Target Architecture” can usually be left on “Auto-Detect,” as it’s good at distinguishing x32 from x64 binaries, though you can force one or the other. This menu also has a checkbox to debug any child processes that your main file may spawn.
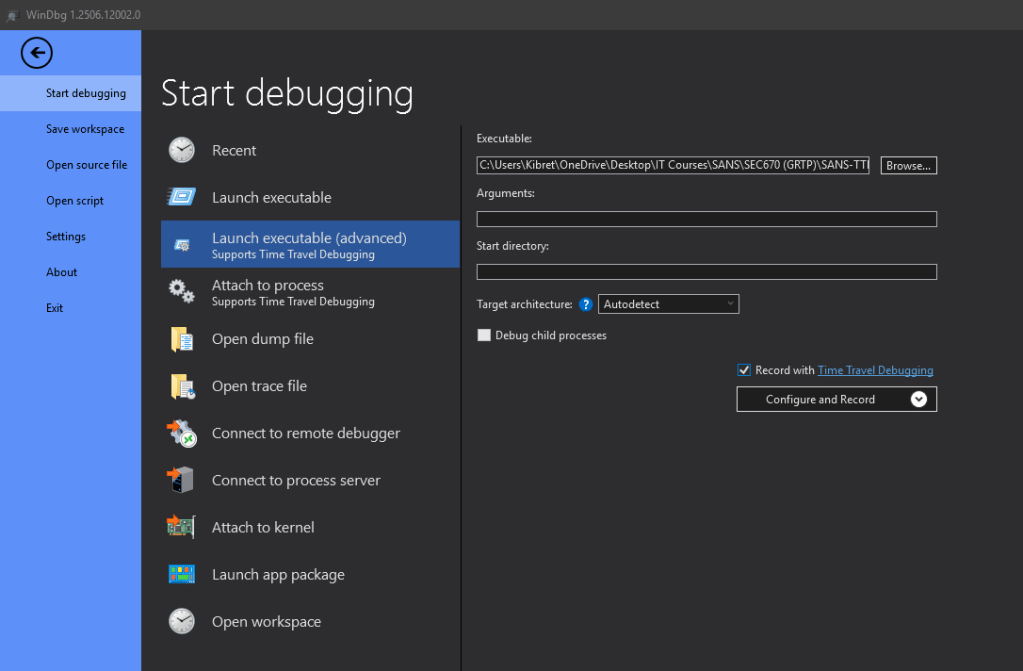
A powerful feature available in the advanced launch menu is the option to “Record with time-travel debugging” (TTD). TTD records everything the process does and stores files that allow you to explore its entire execution lifecycle later. This can save a significant amount of time in future analysis sessions and is particularly useful for implant and malware developers who want to test their creations at specific points.
Other Ways to Start a Session
Besides launching a file directly, you can also “Attach to Process,” which displays a process list similar to Task Manager. To see processes that don’t show by default, such as elevated processes like lsass, you need to use the “Show Processes from All Users” checkbox. However, attaching to these processes is difficult if WinDbg itself isn’t launched with administrative privileges. You can also opt for a “Non-Invasive Attach”.
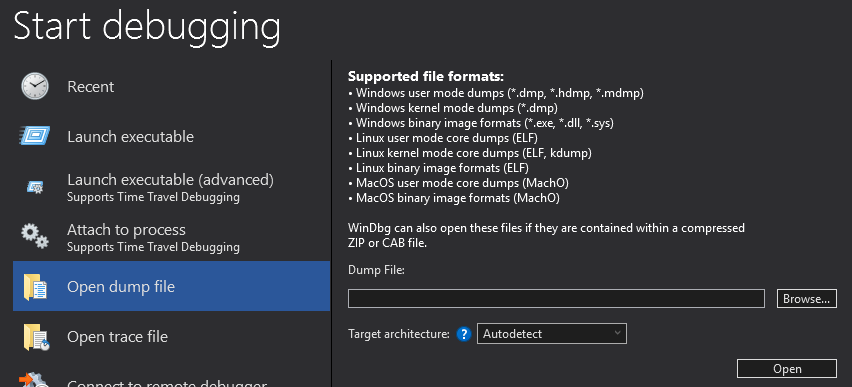
For post-mortem analysis, you can use “Open Dump File” to work with .dmp files created when an application crashes. WinDbg can be used to analyze these files to learn what went wrong, such as a null pointer dereference or an access violation. This feature can also be used to analyze Blue Screen of Death (BSOD) files and even some file types from Linux and macOS. If you have a recording from a TTD session, you would use “Open Trace File” to analyze the corresponding .run file.
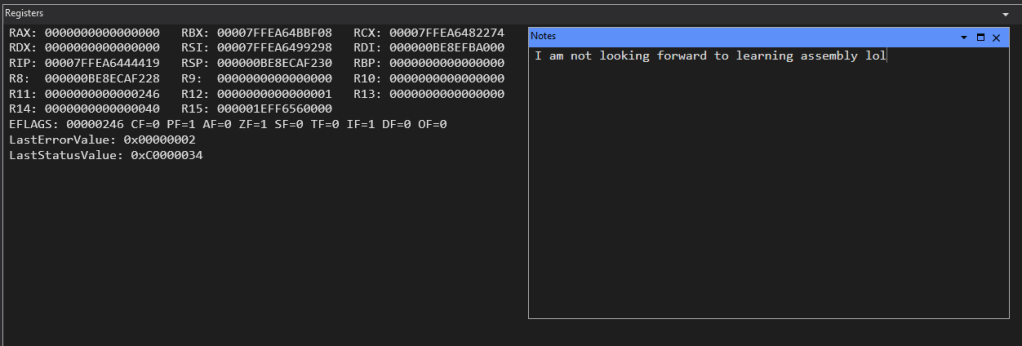
The “Notes” section under “View” is a very useful scratchpad you have as an option to jot down your thoughts mid analysis.
Breakpoints, Time Travel, Model, Scripting, Source, Memory, and Extensions are other options.
- The display of bytes can also be altered as well as the text columns next to it.
Opening up notepad.exe brings up Windows DLLs that are a part of its regular function.
- I received the “ntdll!LdrpDoDebuggerBreak+0x35” error when opening notepad in WinDbg.
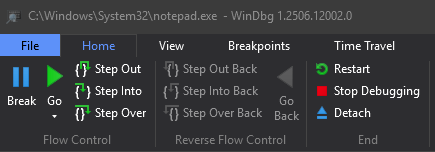
From the “Home” menu, you have basic controls to stop debugging, restart the executable, or detach from the process. By selecting “Go,” you allow Notepad to run normally, and you can interact with it. This is a key step, as some malware implements anti-debugging techniques and will terminate or change behavior if it detects it’s being analyzed
You can choose to step through the program’s execution in either “Source” or “Assembly” mode. “Source” mode is best when you have the source code files , which is not an option for closed-source Windows processes.
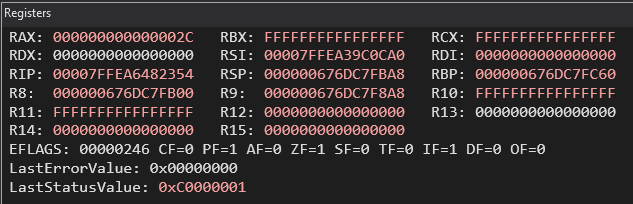
After pausing the execution, you can review the memory registers and disassembly. The register window shows values for RAX, RIP (Register Instruction Pointer), RSP (Register Stack Pointer), and others. Below these are the EFLAGS (extended flags), which are broken down into sub-flags like CF, PF, AF, etc.. Any values in the register or memory windows that have changed are color-coded. This is helpful for tracking changes in a specific buffer or memory page. To navigate, you can use “Step Out” (to leave a function), “Step Into” (to enter a function for deeper analysis), or “Step Over” (to skip the function).
Working with Modules and Commands
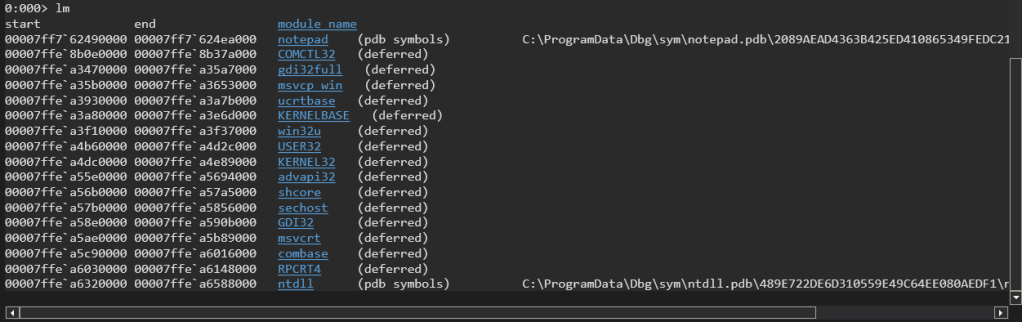
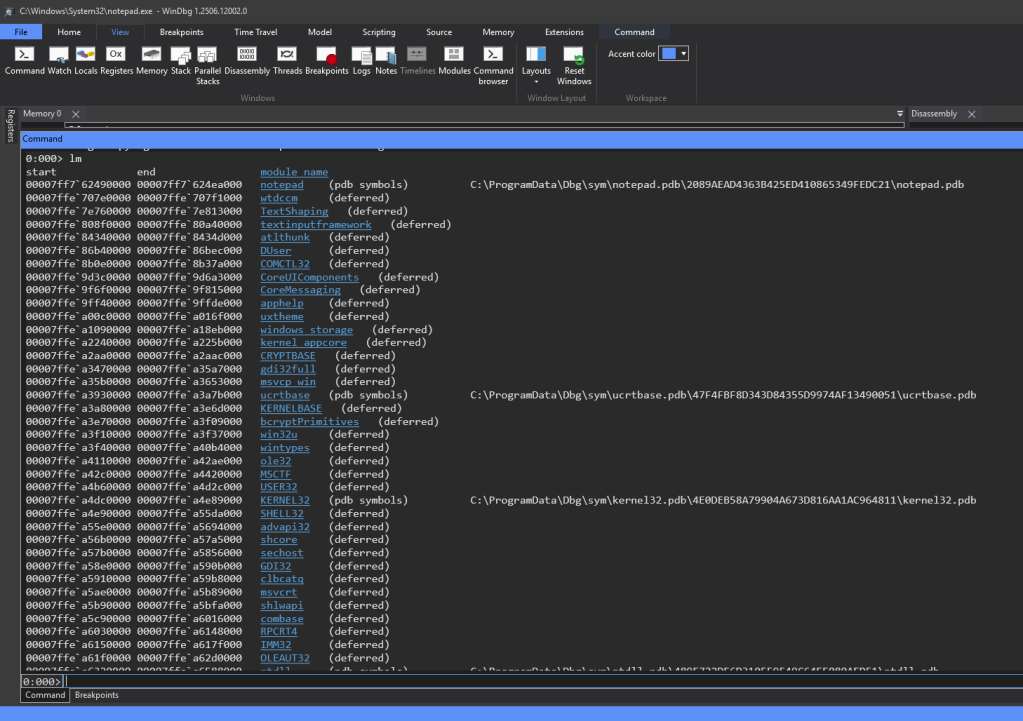
By typing “lm” (listing modules) in the command bar of the command window you can get a list of all the DLLs loaded by notepad. Restarting notepad and running “lm” again might show loaded and/or unloaded DLLs.Deferred DLLs are ones that haven’t had a request processed yet for pulling PDB files for symbols for things like notepad, ntdll, etc.The blue hyperlinks in the command window for the loaded DLLs provide you with a more detailed profile on the individual DLLs if you click on it.
The list of loaded DLL modules has a start column, end column, and module name column. The start column shows the starting memory address where that module is located and the end column is the last byte of that module. If you find the difference between the two you’ll have the size of the module.
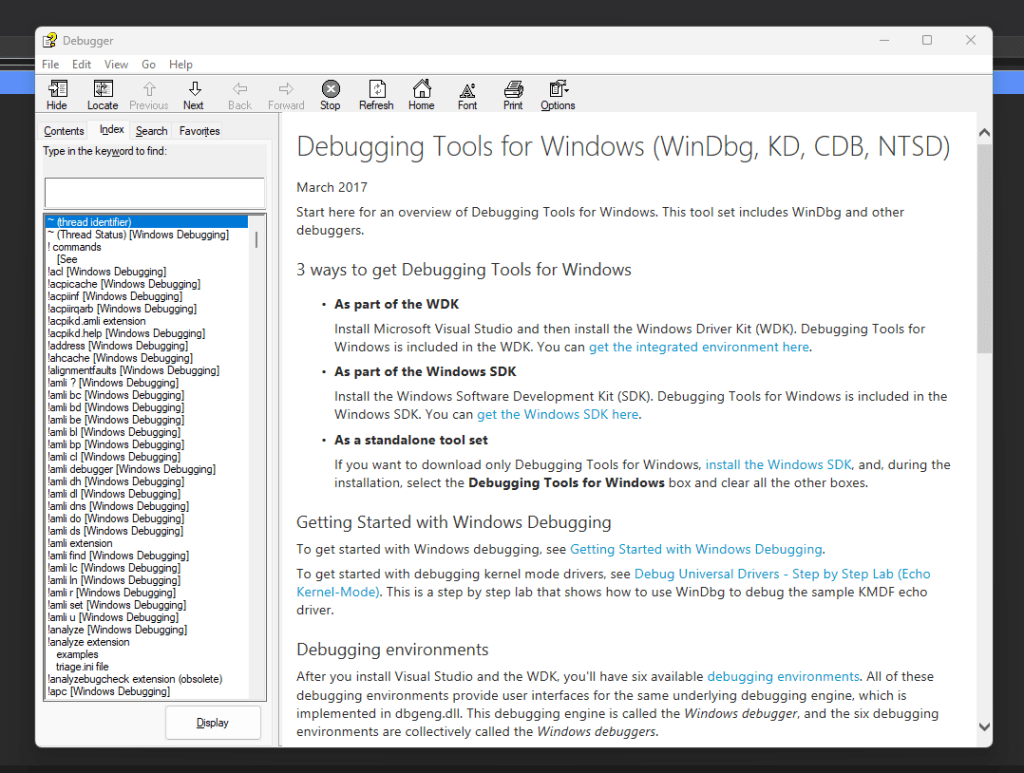
To learn any WinDbg command, you can type .hh in the command bar to bring up the help menu , which provides examples and explains the various options. For instance, the help file would show that while lm lists modules by their start address, lmsm lists them in alphabetical order.
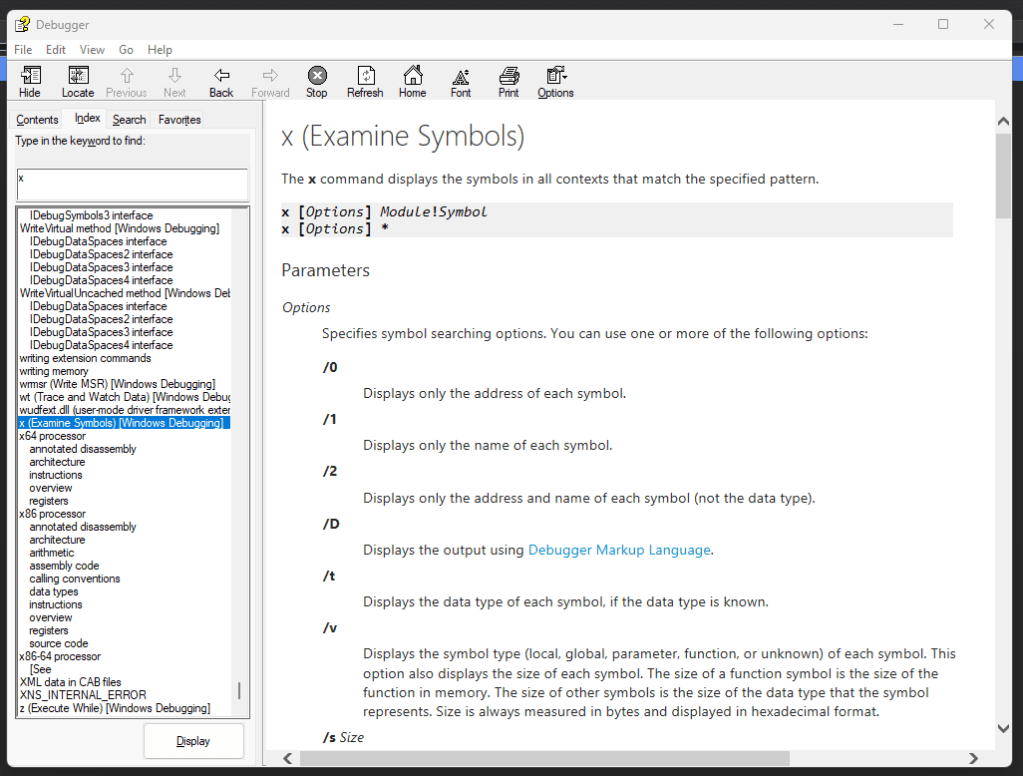
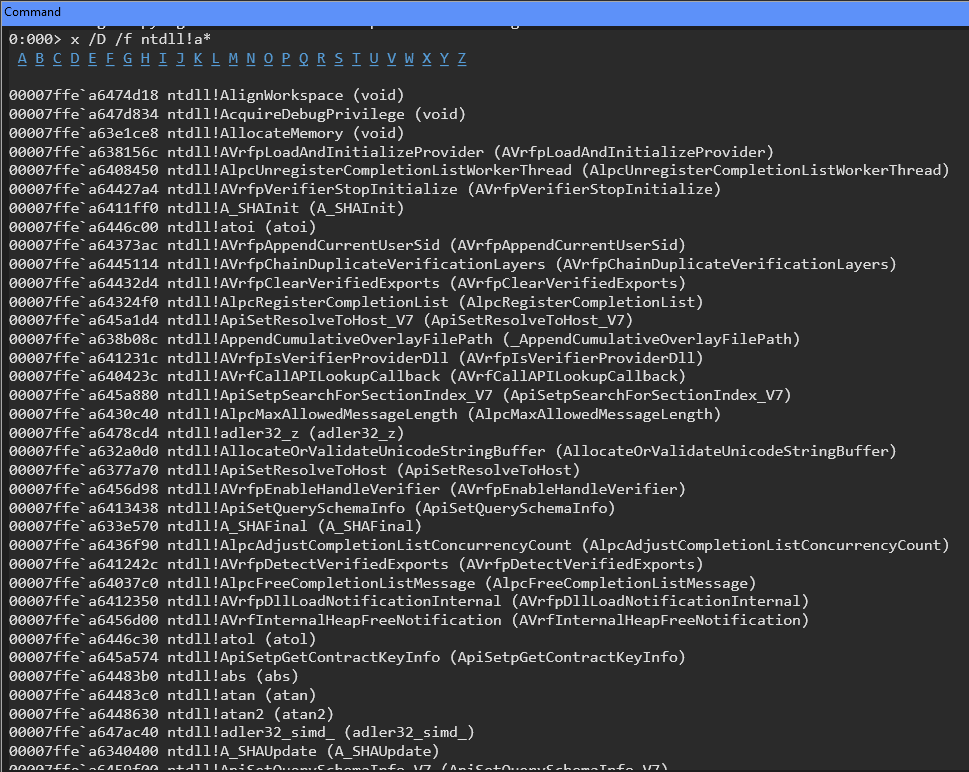
Another important command is x (Examine Symbols), which finds symbols matching a specific pattern. It’s risky to use this with a broad wildcard, as it can take a long time, especially if the Microsoft symbol servers are down. It’s also important to note that WinDbg command syntax can be inconsistent; some commands, like lmsm, bundle options into the command string , while others, like x, require spaces and forward slashes (e.g., x /D /f notepad!a*).
Documentation Issues
A significant challenge in debugging is dealing with undocumented Windows structures. Knowing how Windows Internals are laid out is crucial, and resources like The Vergilius Project and ReactOS are invaluable for this.
- https://reactos.org/ (Also checks out undocumented structures and APIs)
When getting pdb symbols from Microsoft information about structures is in there too, but might not be documented in MSDN. Some researchers have fancy extractor scripts to extract type information from those .pdb files. (ie. For things like parameters or pointers)
Clicking on the module hyperlinks also includes the command that was run to pull that info (ie. lmDvmnotepad which means list module in Debugger verbose markup language)
Finally, Mr. Reiter noted that while WinDbg is powerful, it isn’t the best tool for patch diffing (comparing patched and unpatched program versions); BinDiff is the de-facto standard for that. He also shared his personal preferences: he favors X64Dbg for user-mode analysis and uses WinDbg for Windows kernel debugging.

Sound off in the comments about anything InfoSec or InfoTech.