Introduction to WinDbg and Time Travel Debugging
Continuing the “Learn with Me” series on the introduction to WinDbg, this time we focus on Time Travel Debugging (TTD), as presented in the second part of this seminar series by Kevin Ott.
Kevin Ott is a professional red teamer, purple teamer, and R&D specialist for implants and C2, who also serves as an instructor for SEC670. The examples discussed primarily involve programs written in C++.
The GitHub repository for the webcast, which includes relevant code, can be found at: https://github.com/shellhunter/SANS-TTD-Workshop.
Understanding Time Travel Debugging (TTD)
Time Travel Debugging (TTD) is a powerful feature in WinDbg that allows a debugger to record the execution of a program and then replay it, moving both forwards and backwards through the program’s history. This eliminates the need to restart dynamic analysis to revisit previous states or actions, significantly streamlining the debugging process.
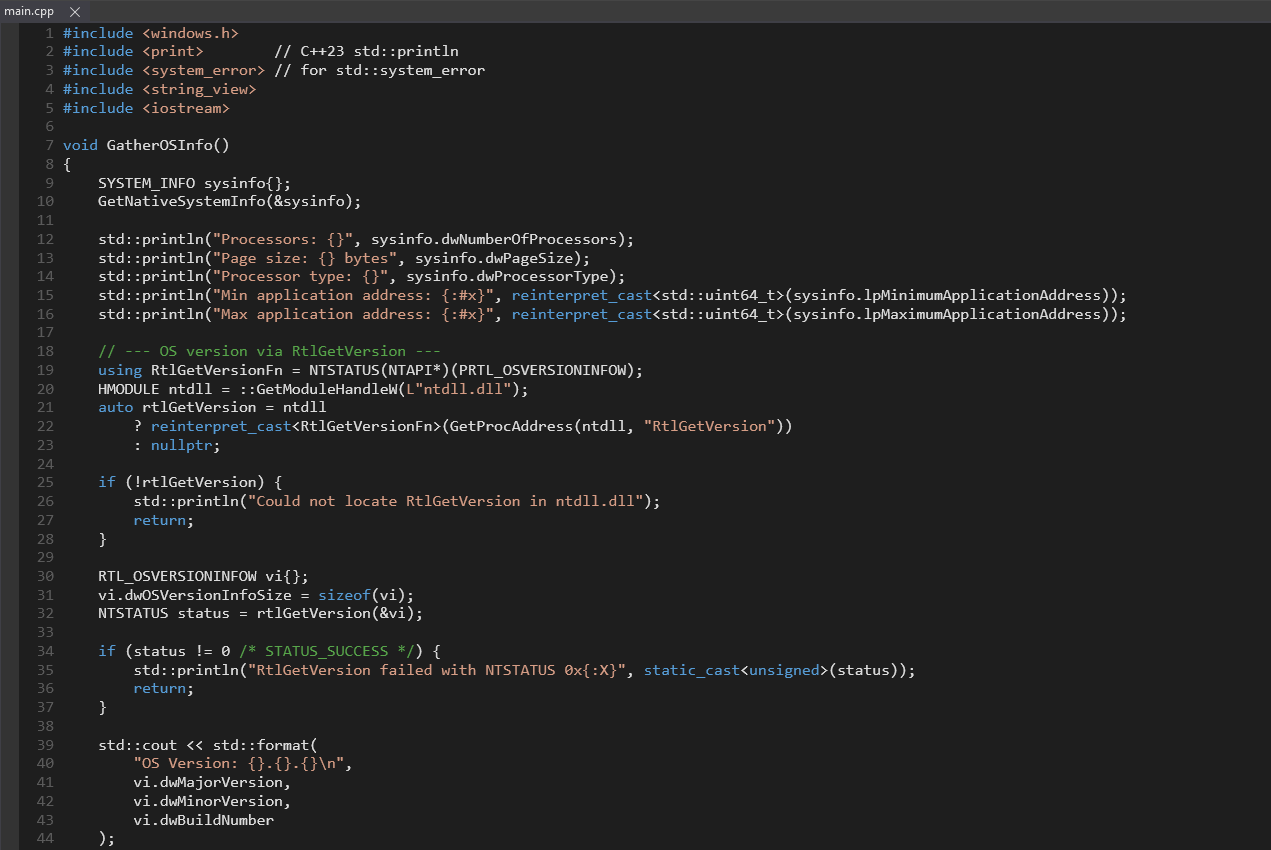
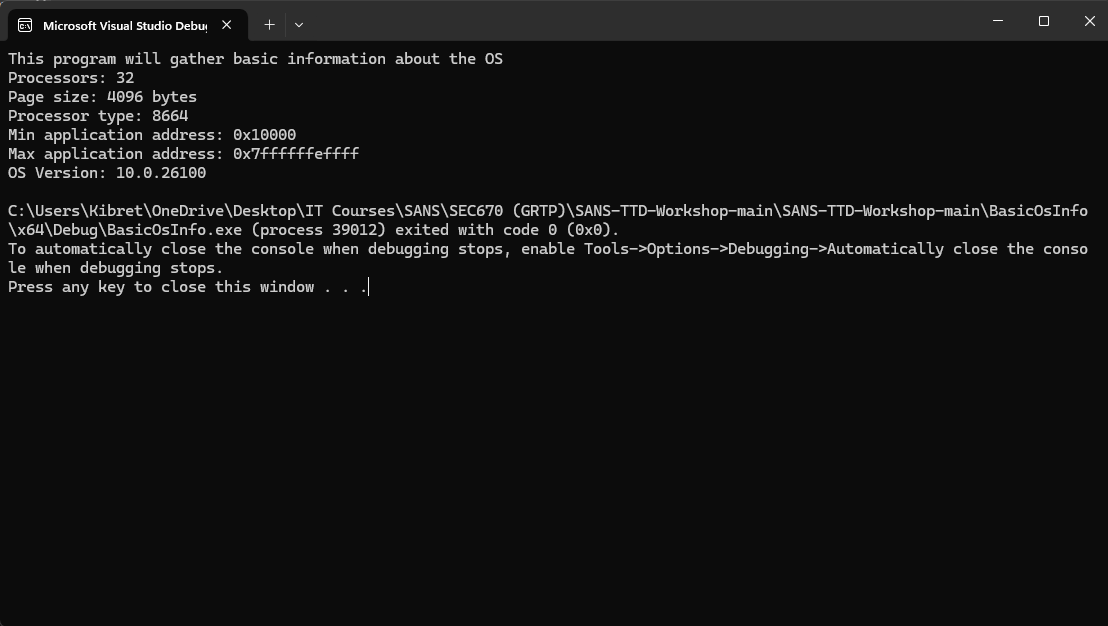
The “BasicOSInfo” code, authored by Kevin Ott, serves as a practical example for demonstrating TTD. This program is designed to extract fundamental operating system information, such as minimum and maximum memory addresses utilized by the application and page size. It also leverages the undocumented rtlGetVersion function within ntdll.dll to retrieve the major version, minor version, and build number of the operating system.
TTD Recording and Files
When a program is run with TTD enabled, WinDbg generates three primary files and a backup folder:
- .run file: This file contains the recorded execution trace, enabling navigation through the program’s timeline.
- .idx (index) file: This file stores the indexed data of all actions performed by the debugged program, facilitating efficient time travel.
- .out file: This file typically contains the standard output of the debugged program.
Preparing for TTD
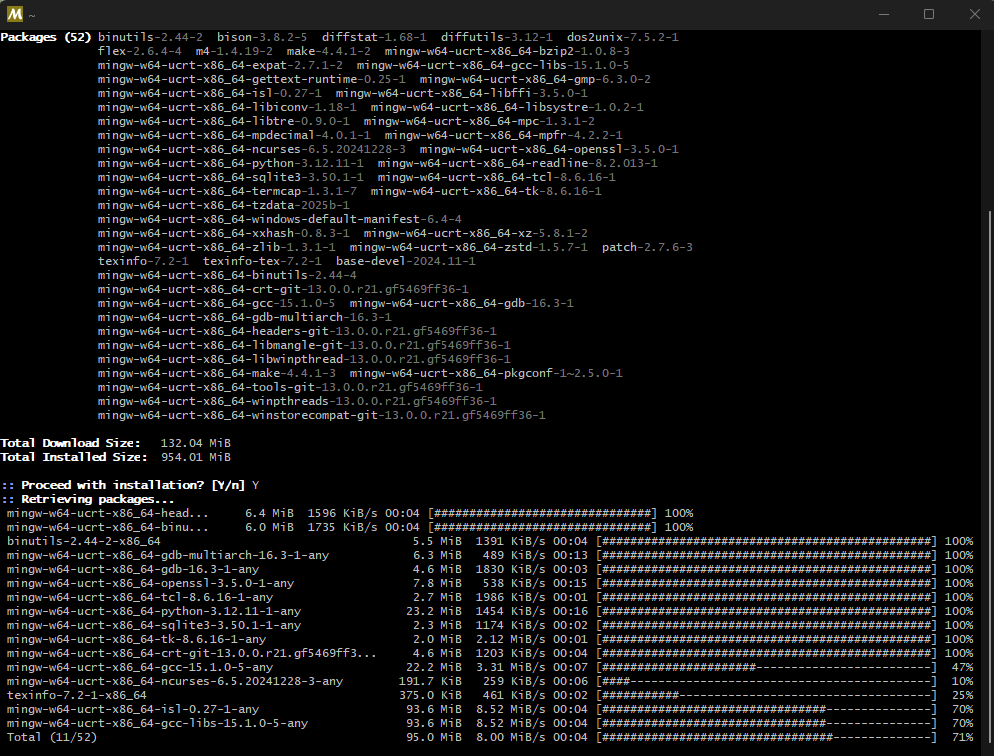
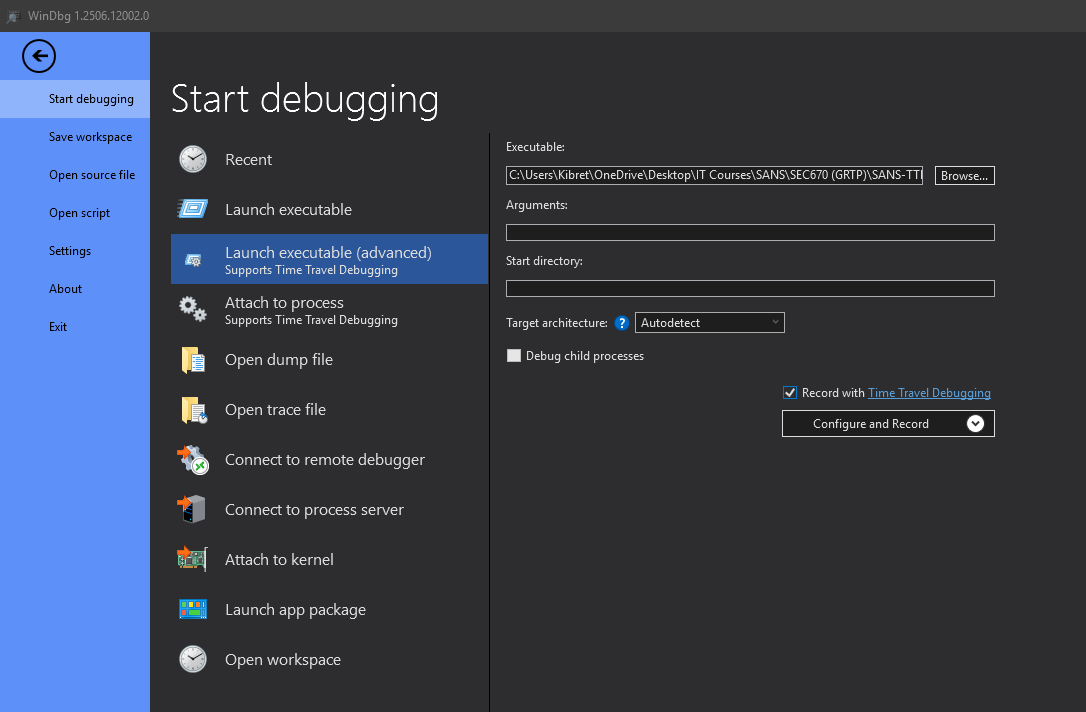
To compile programs for debugging, tools like MSYS2 with the MinGW GCC compiler (https://www.msys2.org/) can be used. Alternatively, Visual Studio can be employed to build executables. Once the executable is prepared and executed within WinDbg for TTD, the program’s output is displayed, accompanied by a visual timeline bar.
Navigating the TTD Timeline

The timeline bar in WinDbg is a crucial visual aid, allowing the addition of various markers such as breakpoints, memory access points, function calls, and exceptions. These markers help in visualizing and understanding the program’s execution flow.
Reverse Flow Controls
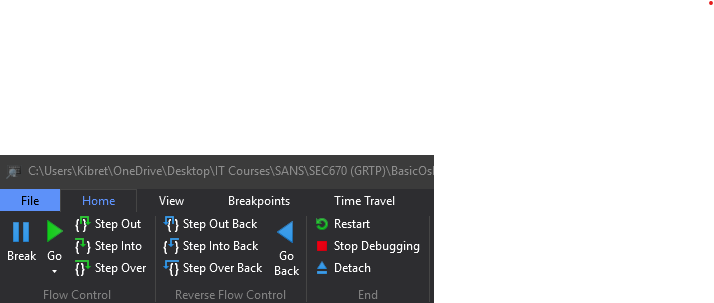
New controls appear in the top-left corner of the WinDbg window when TTD is active: “Step Out Back,” “Step Into Back,” and “Step Over Back.” These are collectively known as “Reverse Flow” controls, enabling backward navigation through the execution.
In the Command window, these actions can also be performed using commands like t (trace) with various options for stepping through instructions. The r command can be used to inspect the memory registers at a specific instruction.
The go Command with TTD

The go (g) command typically runs the program until a breakpoint is hit or the program terminates. Without TTD, if no breakpoints are set, g will lead to ntdll!NtTerminateProcess (or similar termination routines), requiring a restart of the debugging session.
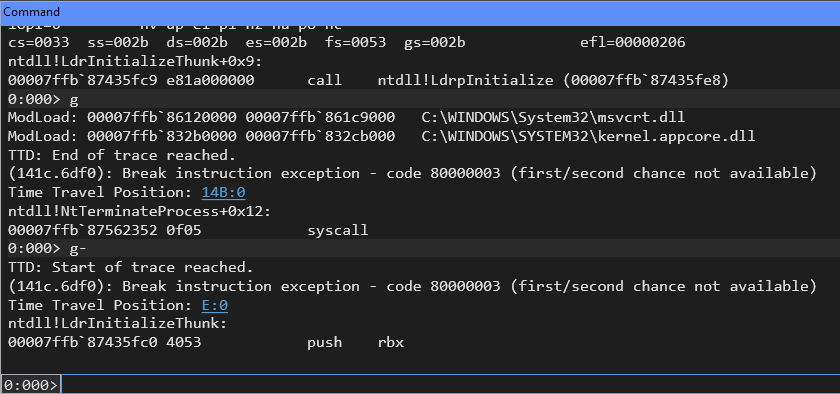
However, with TTD active, the g- command (go backward) allows you to return to the beginning of the trace, preserving your analysis session.
The “Time Travel Position” indicator records your current location within the execution timeline.
Analyzing Function Calls and Program Flow
WinDbg provides powerful commands for analyzing function calls and understanding their interactions with the operating system.
Examining Function Information
The x *!GetNativeSystemInfo command can be used to examine the GetNativeSystemInfo function. This reveals that it pulls information from KERNELBASE!GetNativeSystemInfo, indicating its interaction with the Windows kernel.
Setting and Using Breakpoints
A breakpoint can be set at a specific function call using bp KERNELBASE!GetNativeSystemInfo. After setting the breakpoint, running the program will cause execution to pause at that point. The p- (step backward) command can then be used to step back into the call site in KERNELBASE. Further backward stepping can lead to the original source code location where the function was executed, causing WinDbg to switch from Assembly mode to Source mode and display the source code file in a dedicated panel.
The dx Command for Detailed Information
The dx (Debugger Data Model) command is invaluable for obtaining detailed information about the debugging session. For instance, dx @$cursession (which stands for “current session”) provides an overview of the current session. This command can be extended to explore specific aspects, such as dx @$cursession.Processes to view information about the running processes, and even specify a process ID (e.g., dx @$cursession.Processes[0x141c]) for more granular details.
The dx command supports various objects for exploration, including Environment, Threads, Modules, and TTD. The !peb command can also be used to inspect the Process Environment Block (PEB) information.
TTD-Specific dx Commands
The dx @$cursession.TTD command provides comprehensive insights into the recorded TTD trace, including function calls (their locations and frequency) and memory access patterns.
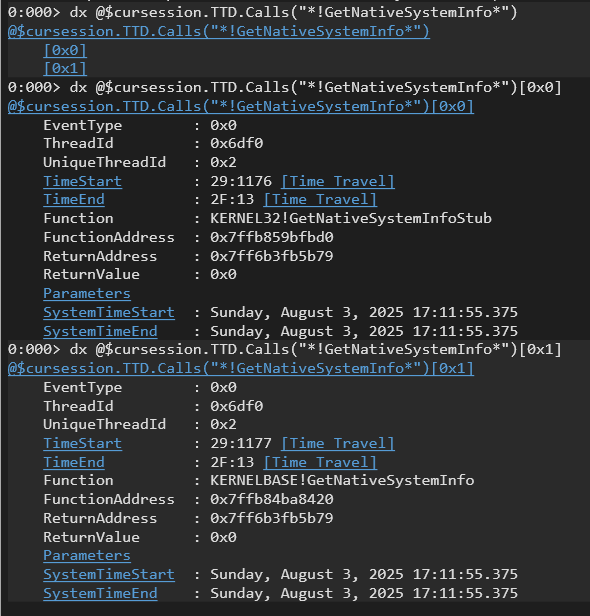
A specific example is dx @$cursession.TTD.Calls(“!GetNativeSystemInfo“), which enumerates all instances where the GetNativeSystemInfo function was called. Adding EventType ([0x0], [0x1]) can provide further details about the call events.
It’s common to observe GetNativeSystemInfoStub being called immediately before GetNativeSystemInfo. This is because many functions in kernel32.dll act as stubs that import and then call the actual implementations within KERNELBASE.dll. While WinDbg can show function parameters, its handling of them can sometimes be less intuitive.
To jump directly to the instruction where GetNativeSystemInfoStub was called, the command dx @$cursession.TTD.Calls(“!GetNativeSystemInfo“)[0].TimeStart.SeekTo() can be used. The disassembly panel will then highlight the exact point where the stub imported the actual method from the Import Address Table (IAT).
By examining the Timeline panel, you can visualize the execution order of functions. A typical call chain might look like:
KERNELBASE!GetNativeSystemInfo > kernel32!GetNativeSystemInfoStub > kernelbase!GetNativeSystemInfo > ntdll!NtQuerySystemInformation
For further reading on the various types of system enumeration that NtQuerySystemInformation can perform, a helpful resource is: https://www.geoffchappell.com/studies/windows/km/ntoskrnl/inc/api/ntexapi/system_information_class.htm.
Monitoring Register Access
Finally, the !tt br- rax command is useful for setting a breakpoint that triggers every time the rax register is accessed. This is particularly effective for identifying when and how a register’s value might have been modified during program execution.
Next time we’ll finish up with the last webinar in the series, https://www.sans.org/webcasts/intro-windbg-part-3-call-me-maybe where calling conventions are analyzed. See you then!
